Opportunity Zones have been enthusiastically embraced by investors, but the response from community development practitioners and community-based groups has been more muted. Many analysts believe that Opportunity Zone incentives will successfully be able to attract investment to under-invested areas. It is less clear whether or not these investments will benefit the residents of these communities or, in fact, become an incentive that accelerates gentrification and displacement.
This blog highlights how Chicago’s designated Opportunity Zones align with displacement pressure in the city’s neighborhoods and discusses what this means for the implementation of Opportunity Zone investments. It highlights the need to consider affordable housing strategies alongside Opportunity Zone investments and illustrates where in the city there is a risk that Opportunity Zone investments may exacerbate current affordability challenges. This blog also highlights the need for tracking conditions in Opportunity Zone neighborhoods and monitoring how investments might be impacting neighborhood stability and housing affordability.
What are Opportunity Zones
Opportunity Zones were created as a part of the 2017 federal tax reform bill as a tool to attract private capital to underinvested neighborhoods. The program creates tax incentives for investors to redeploy capital gains into eligible Opportunity Funds. These funds serve as intermediaries to invest this capital into designated low-income census tracts. There are few limitations on the types of projects that Opportunity Funds can invest in, but 90 percent of the funds must be invested in designated low-income census tracts.
To be eligible for designation as an Opportunity Zone tract, a tract must meet certain poverty or income thresholds. Each state was able to designate 25 percent of their eligible census tracts (or 25 tracts if a state has fewer than 100 eligible census tracts) as Opportunity Zones. Outside of meeting these basic criteria, states could choose any eligible tract for designation. An analysis by the Urban Institute highlighted that many states designated tracts as Opportunity Zones that, while technically low-income, were not starved for investment because they, in some cases, were near downtowns or in other locations attractive to investors.
The Urban Institute also found that Chicago, in its Opportunity Zone designations, did not cherry pick eligible tracts that already were experiencing strong investment, but, in fact, primarily focused the city’s Opportunity Zones in eligible tracts that were also under-invested.
Mapping Displacement Pressure in Chicago
Opportunity Zones are designed to attract new investment to low-income communities, but with new place-based investments comes the risk that market forces threaten neighborhood affordability. In response to concerns that large, place-based investment projects in Chicago, like The 606, were driving the displacement of lower-income residents from surrounding neighborhoods, IHS developed a set of neighborhood market typologies to act as a leading indicator of displacement risk. These typologies highlight neighborhoods where 1) house prices recently appreciated at levels above the city average and where 2) a significant share of residents are vulnerable to displacement due to factors such as income, housing cost burden, and renter status. IHS then grouped these rising and vulnerable tracts by current home values to highlight different levels of displacement risk with high-cost areas experiencing higher displacement risk and lower-cost areas experiencing lower displacement risk. Finally, IHS linked each neighborhood typology to affordable housing strategies that respond to the unique conditions of each group.
To understand how Chicago’s designated Opportunity Zone census tracts align with the risk of displacement pressure for lower-income residents, IHS mapped our Mapping Displacement Pressure in Chicago neighborhood typologies against Chicago’s designated Opportunity Zone tracts. The interactive map and table below show the overlap of Chicago’s Opportunity Zone tracts with these displacement pressure market types.
Figure 1. Chicago Opportunity Zone Designated Census Tracts
| Housing Market Category | Total | |||
| High-Cost | Moderate-Cost | Lower-Cost | ||
| Vulnerable Tracts with Rising Prices | 3 | 22 | 82 | 107 |
|---|---|---|---|---|
| Other Tracts | 0 | 2 | 26 | 28 |
| Total OZ Tracts | 3 | 24 | 108 | 135 |
Most Opportunity Zones in Chicago are in communities starved for investment that have lower-risks of short-term affordability pressure. As Figure 1 above shows 107 Opportunity Zone census tracts, or nearly nearly 80 percent of the city's 135, met the criteria of having some level of displacement pressure. However, 82 of these Opportunity Zone tracts tend to be concentrated in lower-cost neighborhoods that have historically been starved of new investment. Recent displacement in these neighborhoods is more the product of decades of disinvestment as opposed to rising housing costs. Rising prices in these areas can be considered positive, but may also be the product of speculative investment activity.
Most of these these areas are likely at limited immediate risk of gentrification. These are the types of neighborhoods that could benefit from Opportunity Zone investments if these investments are responsive to community needs, aligned with both a broad spectrum of place-based community development strategies to improve neighborhood quality of life, and include affordable housing strategies to support existing residents.
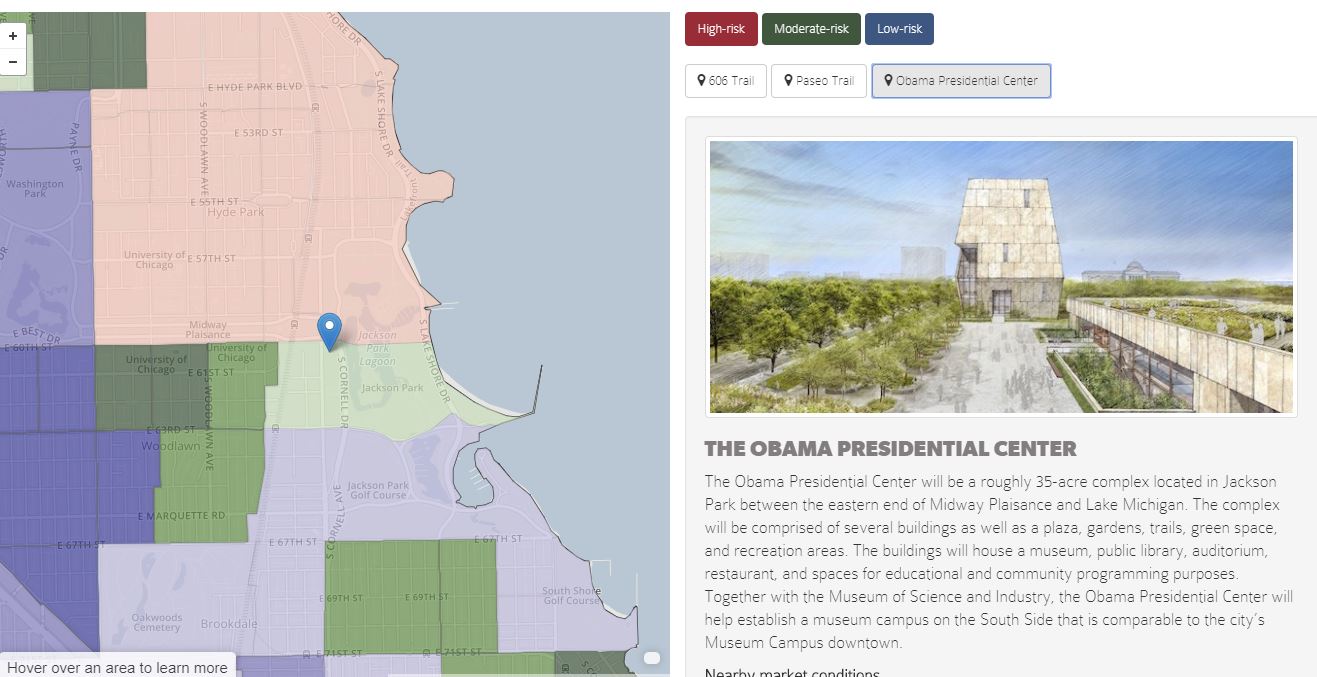
Figure 2. Opportunity Zones and Displacement Pressure
(Zoom and search controls are on the bottom-left. Click on a census tract for additional information. For a full page map, click here.)
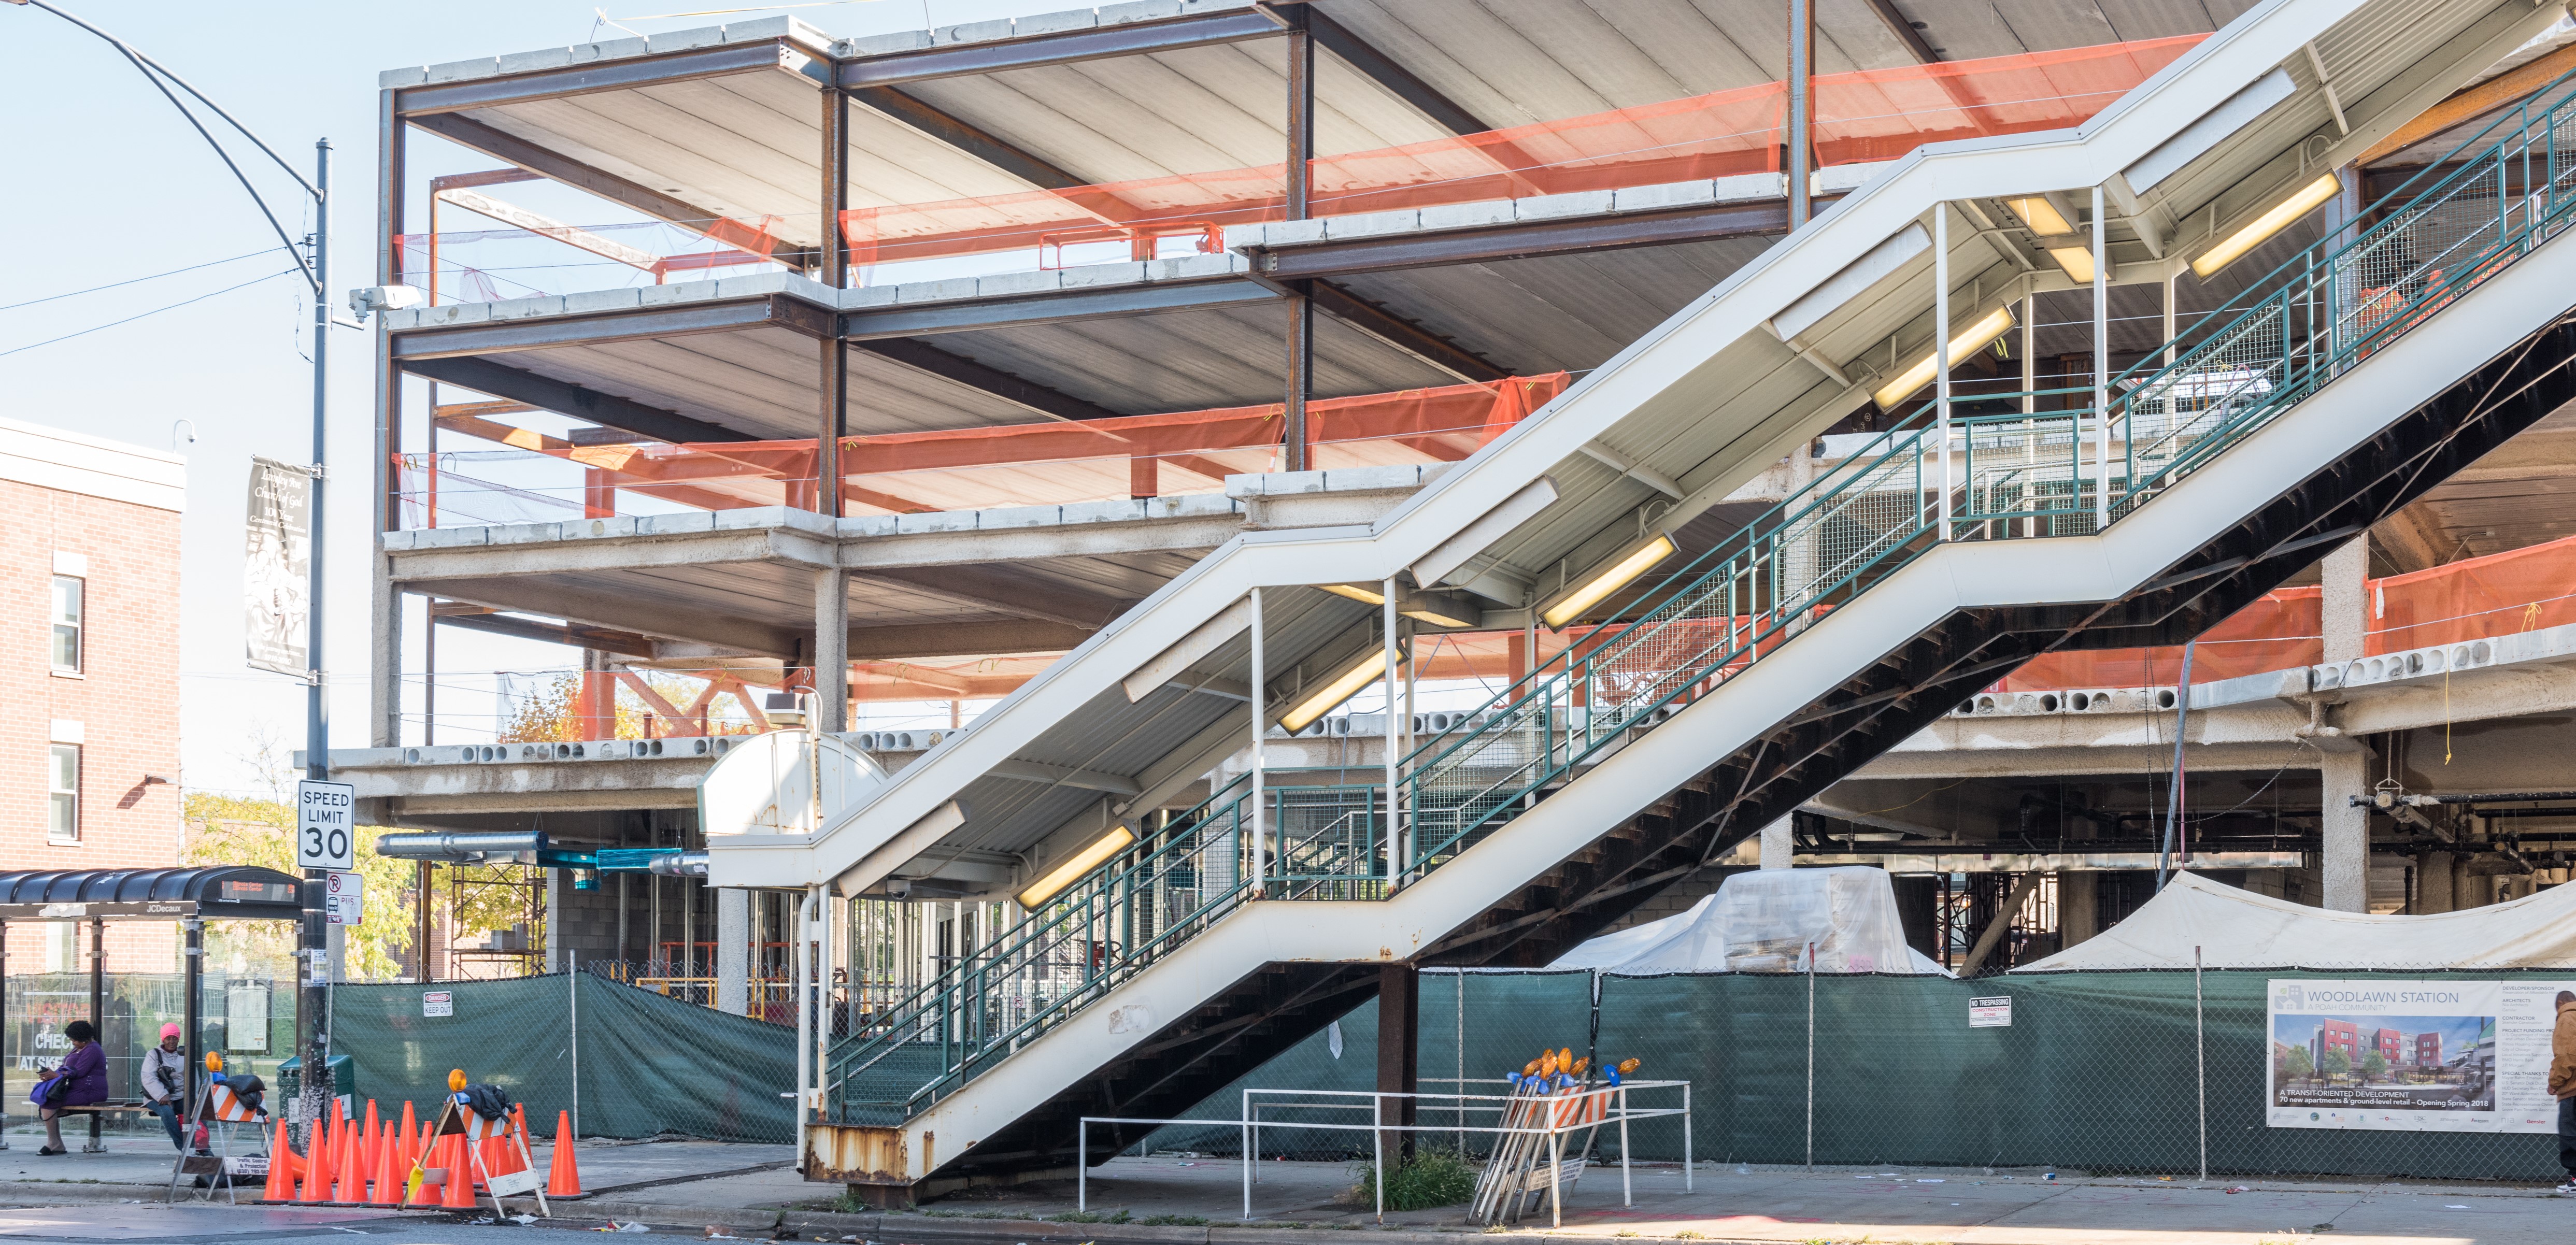
A smaller group of Chicago’s Opportunity Zone tracts have characteristics pointing toward more immediate risk of gentrification and displacement. As Figure 2 above shows, there are three Opportunity Zone census tracts on the city’s near west and south sides fall into IHS’s highest-risk displacement pressure category. Not surprisingly, all three high-cost tracts are already attracting serious interest from investors. There are another 22 moderate-risk OZ tracts in Chicago found in neighborhoods including Bronzeville, Woodlawn, Little Village, Humboldt Park, and East Garfield Park. Many of these Opportunity Zone tracts are likely to be very attractive to investors given their combination of affordable real estate, rising values, and proximity to amenities like transit, Lake Michigan, or large projects like the future Obama Presidential Center. In general, these areas should be closely monitored for growing market pressure and lost affordability, but in particular in association with Opportunity Zone investments.
Monitoring Market Conditions in Opportunity Zones
The Opportunity Zone program presents a potentially exciting opportunity to attract private capital to previously underinvested neighborhoods. However, with this opportunity, there does come risk that these investments will not benefit current neighborhood residents. The program has no requirements that Opportunity Zone investments meet community needs, and the program does not explicitly mandate that investments provide any direct benefit to current community members. There is also little oversight or data available to monitor Opportunity Zone investments or assess their impacts.
IHS’s mapping displacement pressure work gives practitioners and policymakers a tool to monitor these risks by serving as a leading indicator to understand neighborhood-level displacement pressure and providing a market-based lens to guide proactive interventions to advance equitable and inclusive policies that preserve housing affordability. Applied to Opportunity Zone tracts, this lens can help inform strategy around deploying investments to areas of need, highlight the need for housing affordability and the most impactful strategies, and track changes in housing markets as an early warning for housing affordability pressure.
For more information on how to work with IHS on this and other issues, email Sarah Duda at sduda1@depaul.edu.